If you haven’t taken notice of the West Coast wildfires yet, all you need to do is look up.
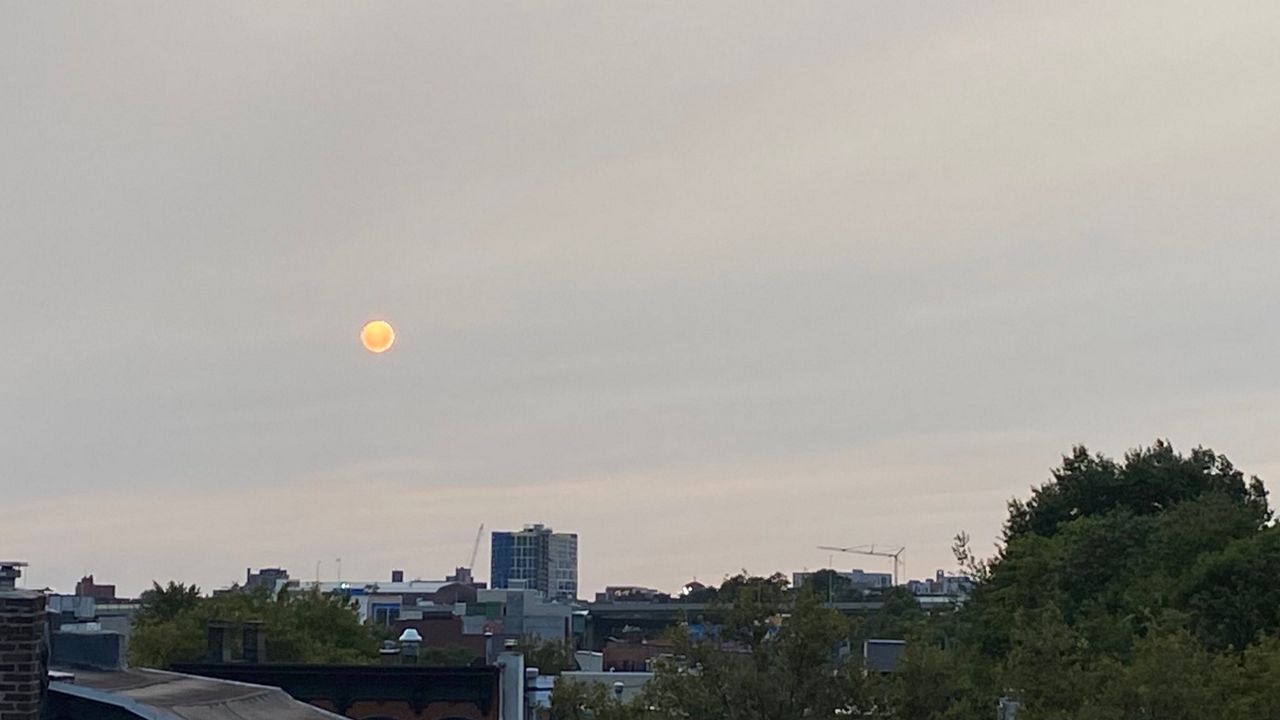
For the first time this fire season, residents coast to coast woke up to milky white skies, instead of the classic light blue, on Tuesday morning. In fact, on Monday evening, social media was abuzz with countless photos of the sun’s “weird appearance” before sunset.
Wildfires burned over a million acres in California this year, a record-setting pace harming air quality and creating short and long-term public health risks.
Three out of California’s four largest wildfires in recorded history are burning right now. The smoke from these fires extends across most of the lower 48 states through the rest of this week.
The states that don’t see the smoke are about to get lashed by Hurricane Sally, forecast to deliver flooding rains.
Smoke on Tuesday was thick enough over the East Coast that temperatures held in the low-to-mid 60s for much of the day.
Smoke particles are proven to reflect sunlight allowing only certain wavelengths of solar radiation though. Previous volcanic eruptions like Mt. Pinatubo in 1991, spewed enough ash into the atmosphere, that the global average temperature dropped a whole degree for the 15 months that followed.
The health effects depend on where you live. East Coast resident? The wildfire smoke shouldn't worry you too much. For West Coast residents, the pandemic makes the smoke effects especially tricky.
Here are just a few examples from The International Association of Emergency Managers (IAEM):
The COVID-19 pandemic is changing the ways firefighters, meteorologists, and emergency management personnel respond to wildfires this season, hampering teamwork and communication.
Wildfire smoke contains PM2.5 particles which can get deep into lungs, triggering and exacerbating health risks including asthma and heart attacks. Research shows that exposure to smoke increases influenza risks the following winter, and concerns that a similar pattern may hold true for COVID-19.
Research underway globally has been showing that various types of pollution can affect COVID-19 risks.
Outdoor laborers (farmers, pickers, harvesters) can be heavily affected by smoke pollution.
The air quality at the West Coast sites are showing up as purple on this map: the poorest air quality in the world, currently.
We can easily see the high smoke level over the East Coast from a variety of computer models. The first, shows the smoke particles in yellow from the NASA GEOS-5 model that has been shown during Weather on the 1s the past few nights.
This particular model is helpful in determining thickness and spread of where the wildfire smoke will be in the next 7 days. In the animation below, it is shown through Sunday afternoon.
Notice how a front this Friday will clear the air for the Northeast, bringing back blue sky by the weekend.
However, the smoke travels further south this weekend, entering Texas, Louisiana, Mississippi, and Alabama beginning at the end of this week.
Looking at the ground level smoke, seen above, most of the low level smoke, that is impacting air quality, remains in the West. This model is called the High Resolution Rapid Refresh from NOAA.
We can furthermore examine a vertical profile of smoke that shows exactly where in the sky and what altitude layer the smoke layer resides in at specific locations around the United States. Over NYC, the smoke layer is thickest at about 3 miles high.
This diagram imagines that you’re standing just south of NYC, looking north. The top of the diagram is straight up. Note the hills of central New Jersey at the bottom left of the diagram in black.
Commercial aircraft would fly near the top of this diagram, at 9 kilometers. The smoke is concentrated at about 1.5 miles high and extends all the way up to 5 miles above the ground.
Now, let’s compare this level and concentration of smoke to what’s happening out west.
This diagram also imagines that you’re looking north, but from the perspective of standing in northern Utah. The mountain ranges, in black, are more evident there.
Notice how the red shades extend right down to the ground. This indicates the high concentration of smoke near the fires’ origins and that it's staying close to the ground in California.
However at the right side of the graphic, the smoke is billowing high in the atmosphere, again, just under the cruising altitude of commercial flights. That elevated, less concentrated smoke is what was carried by the jet stream to many in the Northeast this week.
Last weekend, however, due to the jet stream staying far north, that same West Coast wildfire smoke was carried all the way to London and Paris, a distance of over 6,000 miles, causing hazy skies. You can see the United Kingdom at the top right of this map, distorted sideways.
Remember the dramatic video footage of residents trying to escape last year’s wildfires? Does it seem like it's getting worse and worse, year after year?
With a worsening drought and the fact that the West has warmed two degrees since the 1980s, the science says that tinderbox conditions will continue to persist.
Climate change is contributing to lengthening wildfire season, with hotter, paltry weather drying out landscapes, fueling a greater number of larger fires.
Disclosure: the International Association of Emergency Managers (IAEM) is in a formal partnership with the International Association of Broadcast Meteorologists (IABM). Mike Favetta, this article's author, is on the Board of Directors of the IABM.


