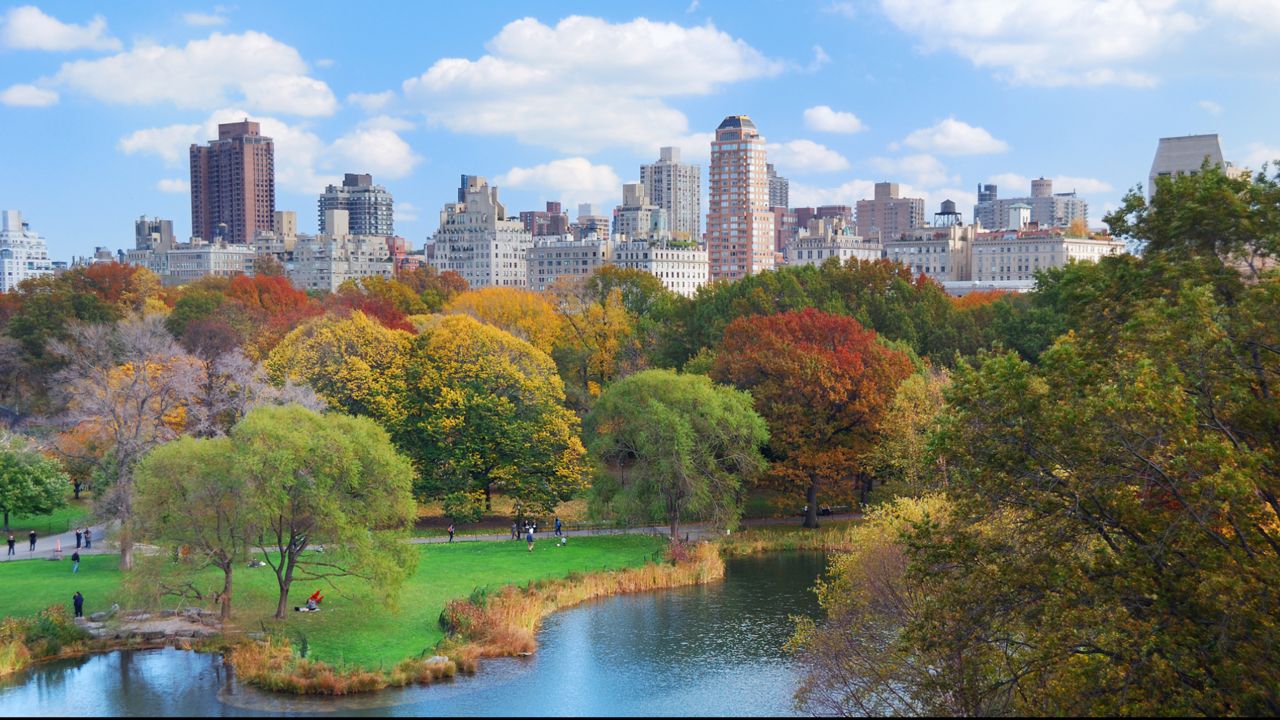
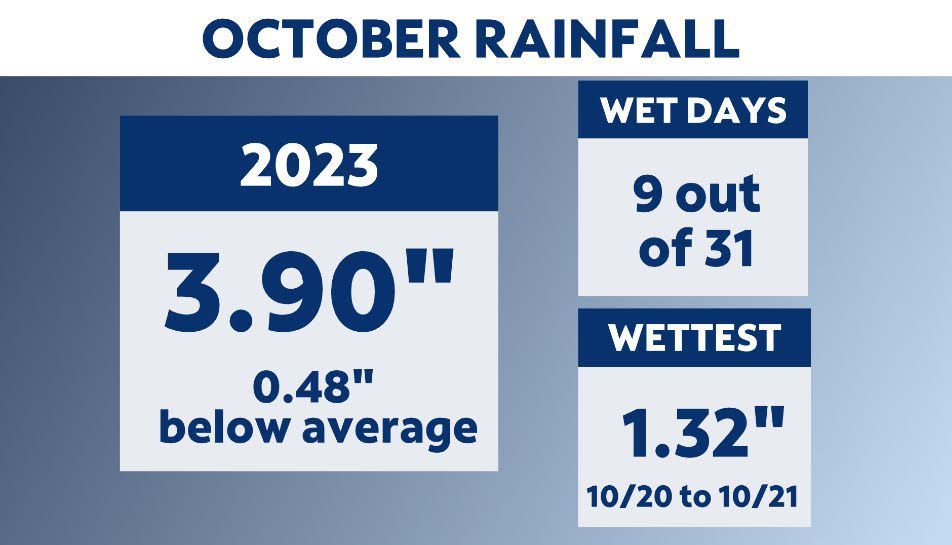
Did October seem wet to you? It actually wasn't.
If you ask most New Yorkers, they'd tell you that October was a wet month, but rainfall was nearly a half-inch below average.
The perception that it was wet might come from the fact that it rained on seven out of the nine weekend days. This wet weekend streak extends all the back to early September. I think most people remember when rain ruins a weekend day as opposed to rain on a school or workday.
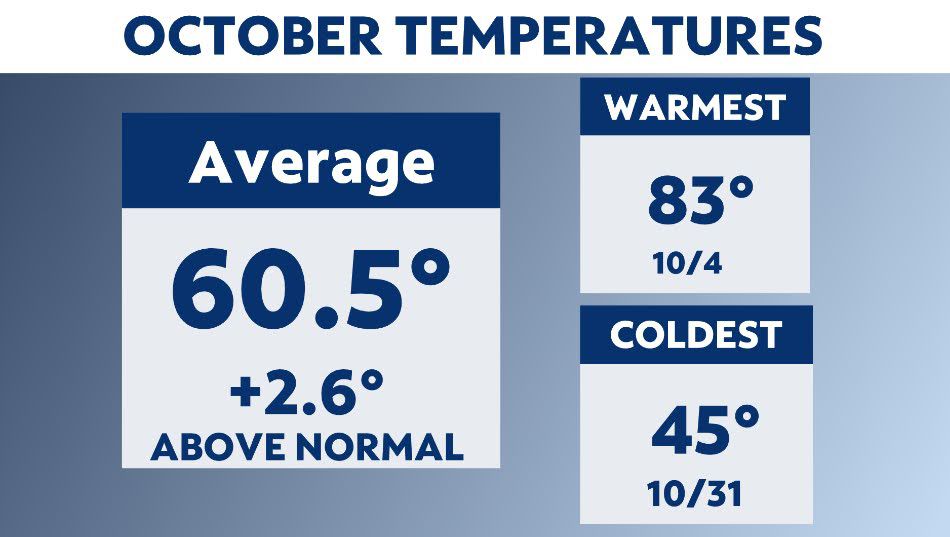
Looking at temperatures, this October was warmer than most. The average temperature was 60.5 degrees. That's almost three degrees above average.
The hottest day was the 4th when readings hit 83 degrees, while the coolest day was Halloween, when readings dropped to a chilling 45 for trick-or-treaters.
One of the highlights of the month was Saturday the 28th. Readings hit 80 degrees and it was the first dry Saturday of the month. The streets and parks were packed with New Yorkers happy to see a dry weekend day. MTA ridership was near record levels as people explored the city in the sunshine. These warmer-than-normal Octobers are becoming more common.
Climate change impacts temperatures throughout the year, but we often see its most dramatic results during the spring and fall seasons. We're seeing hot temperatures earlier in the spring and warm temperatures later into the fall.
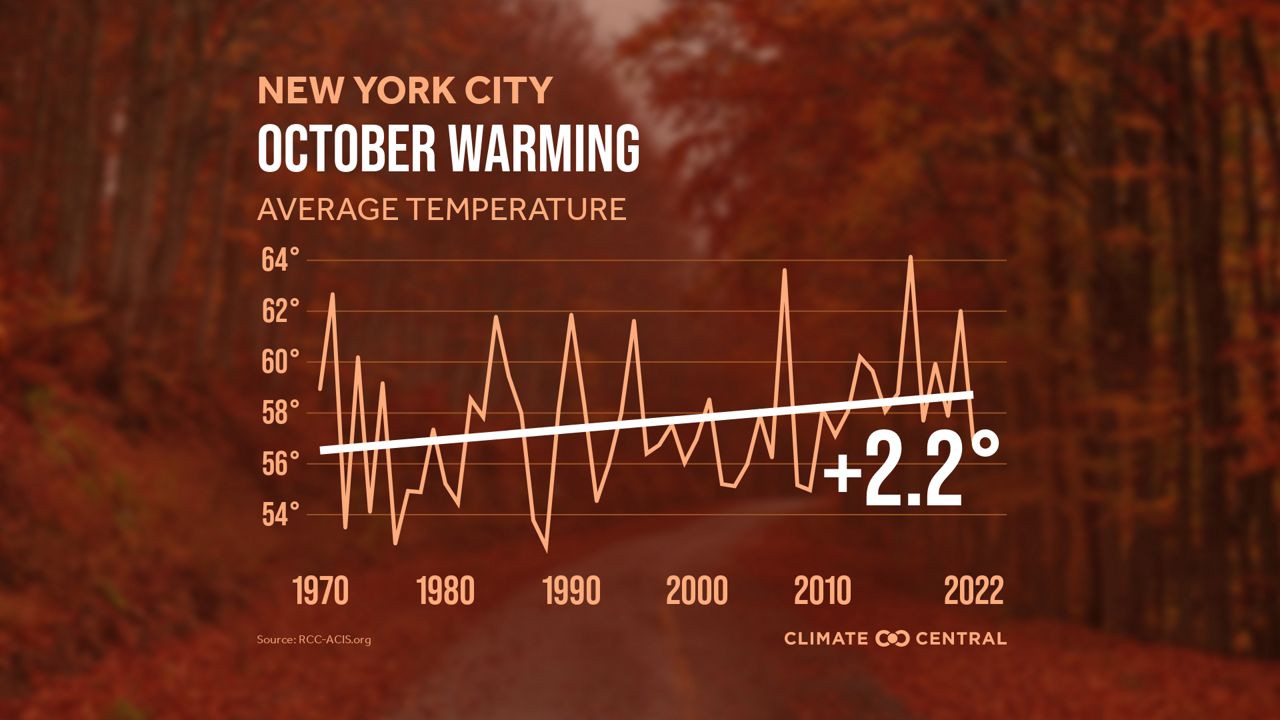
Climate Central analyzed the data for New York City and found that October's average temperature is 2.2 degrees warmer than the average in 1970. This can lead to the leaves changing color later and also extend the fall allergy and mosquito seasons. It can also impact plants and migrating birds as they prepare for winter.
Our team of meteorologists dives deep into the science of weather and breaks down timely weather data and information. To view more weather and climate stories, check out our weather blogs section.


